I love Notion, and I love it even more now that they have released their new Charts feature. Which had me wondering - could I import a csv file into Notion, and use their Charts feature to represent the data? The answer is yes, you can!
Notion is useful as a one platform solution to organise tasks, projects and data, either for yourself or for your team. With the release of Notion Charts, you can now import data and visualise that data with bar or line graphs.
This is useful if you are adopting Notion as your go to workspace. Rather than having to drop links into projects and tasks of externally hosted reports, why not try to just have all the data you need in one place?
Here is an example - I have just done a 12 month analysis of a clients Organic and Paid traffic across Google Ads, Search Console and Google Analytics. Now, I could create and link to a whole bunch of reports. Or, to keep it nice and tidy, I could instead visualise all the data via their portal which is already created in Notion. You've always been able to import csv files, and now with Charts, you can visualise the data you import. Cool!
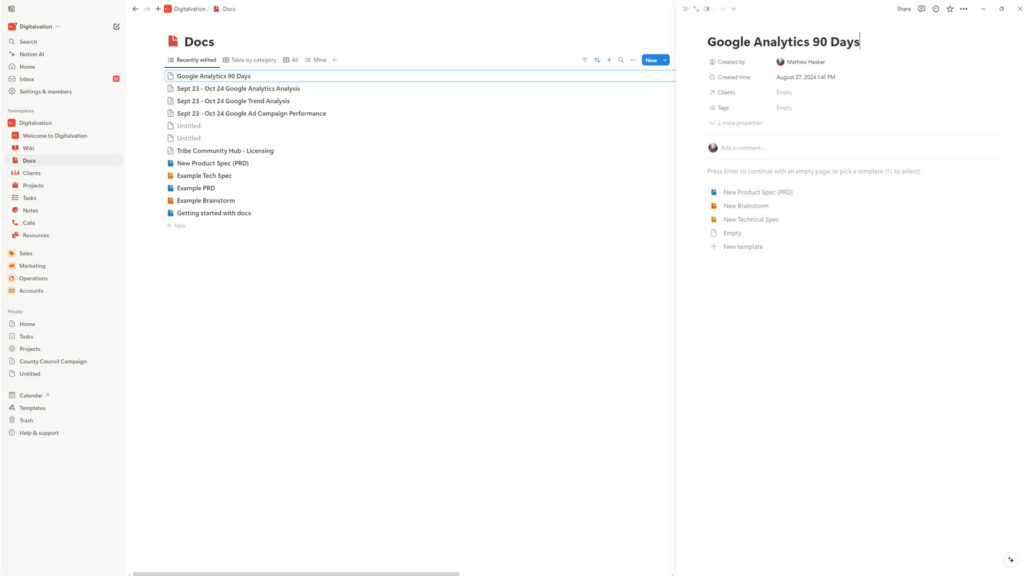
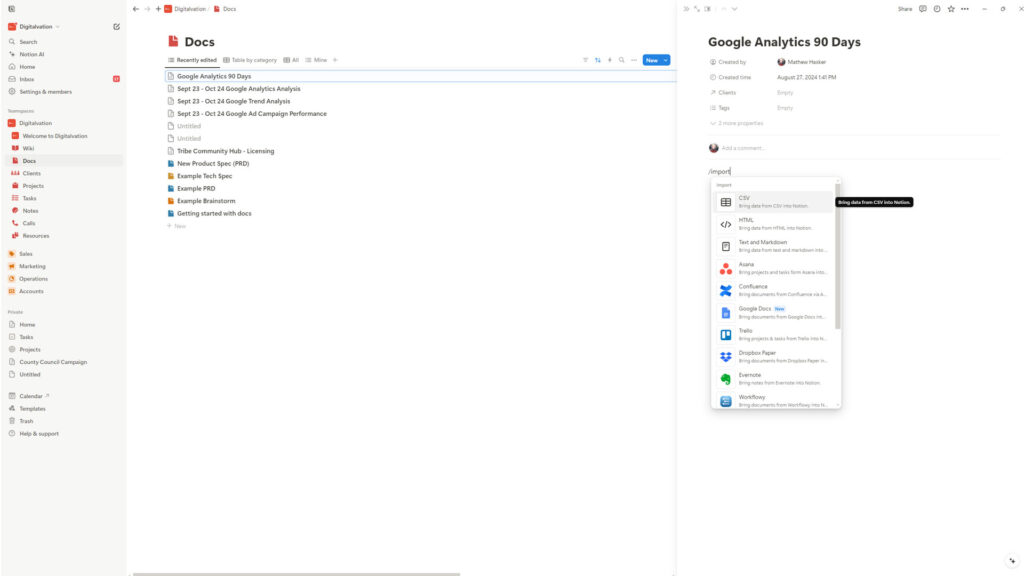
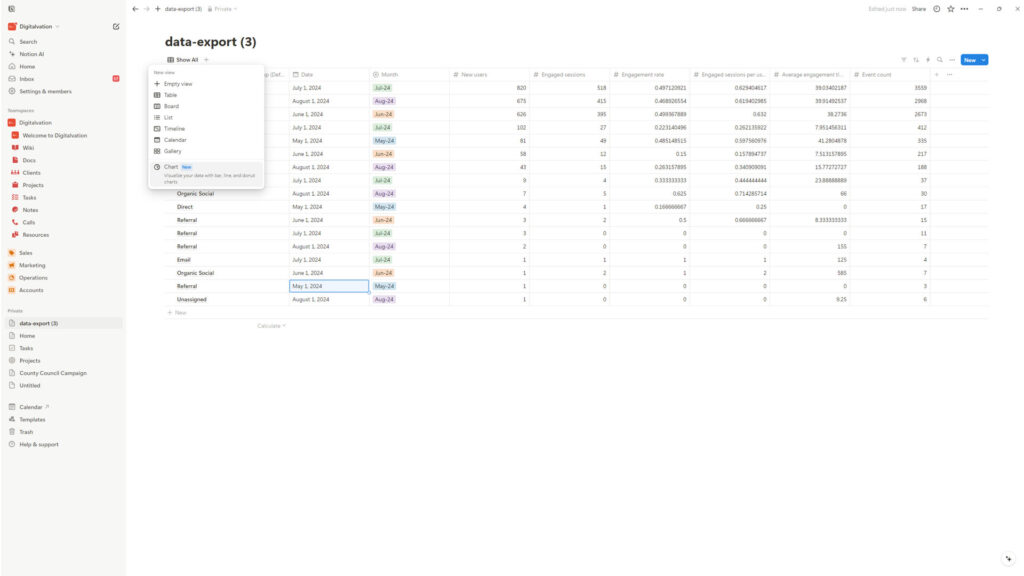
Your first step is to import the CSV file.
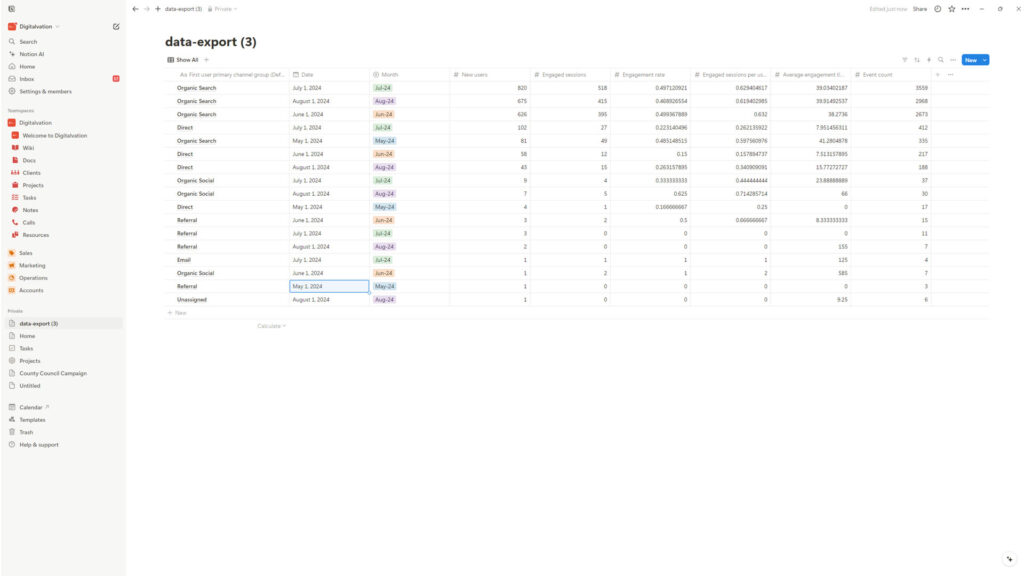
Now that we have the data in Notion, we can start using Notion Charts.
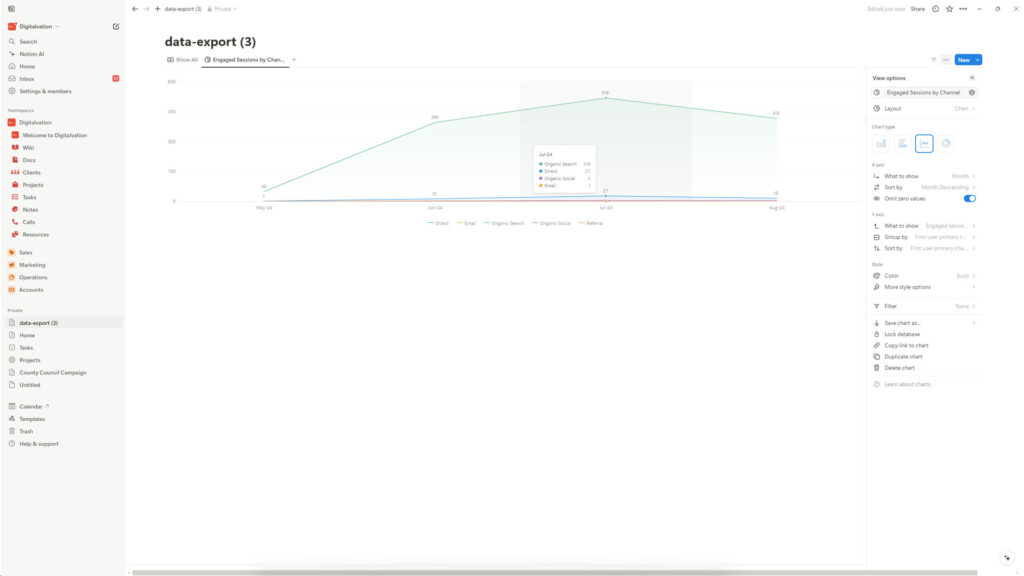
And that's it! I have imported a CSV file into Notion, and turned that data into a Notion Chart.
Notion Charts has only just been released, and can only work with data in an individual database. While it is very useful at working with simple sets of data, I can't see how it is useful for more complex data analytics. PowerBI or Google Looker Studio may still be your go to if you are looking for more comprehensive data reporting and analytics, especially if you are relying on APIs and multiple data sources.
However, whose to say that Notion Charts won't eventually go down this route? I'm keen to explore the possibilities - if I can do it in Notion, that is where it will be done, at least for me!
If you have any questions on this post or any other suggestions that might be useful, please comment below. I will do my best to reply as soon as I can!


This is sooo helpful Mat! Thank you!